


Homebuilders
The moneymaker that the market isn't focused on.

Often, I spend hours using the stock screener on YCharts. I put in different formulas I can think of to try and find attractive investments. These days, I have been seeing the same thing repeatedly, no matter what I do. The three industries the market is consistently underpricing are banking, homebuilding, and oil & gas. This is not to say that nothing else is underpriced, but these are the big three. Right now, I want to talk about homebuilding. Particularly iShares U.S. Home Construction ETF with the ticker symbol: ITB. Homebuilding has been an absolute powerhouse while the world is losing its mind over tech. I will explain what I like about ITB, how the Case-Schiller Home Price Index can easily be used to identify a sell signal and the edge that an everyday person has over Wall Street.
I wish I could remember where I read this… it was in a book about value investing. The author commented on the laughable notion that investors can’t beat the market. Saying something to the effect of “Is there ever a greater advantage in a competition than to have a competitor who believes putting in time and effort has no value?” That’s a paraphrase of someone I can’t remember. Maybe I shouldn’t have used quotation marks, anyway ITB is beating the market. Let’s get right into it:
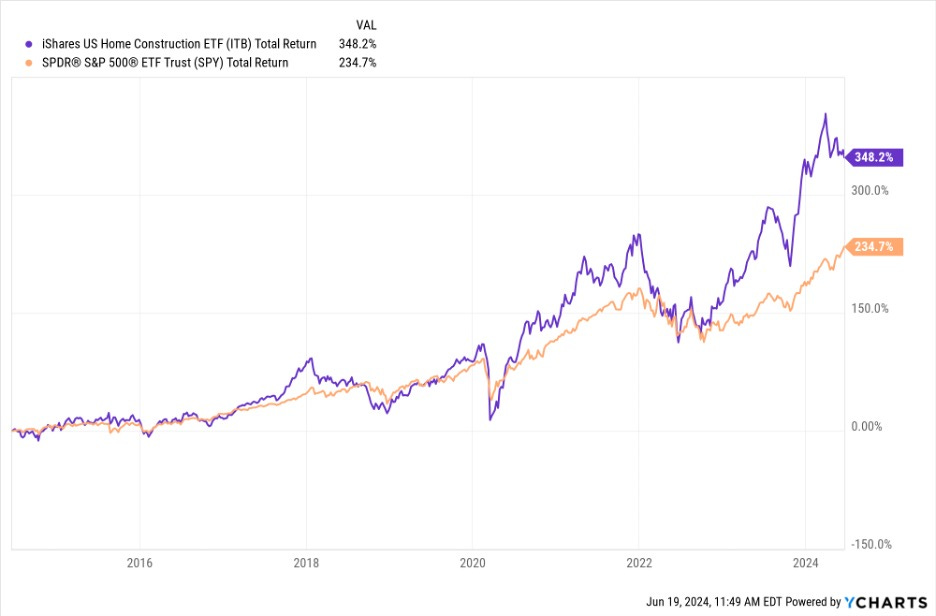
Next is the same chart but zoomed in on the last five years.
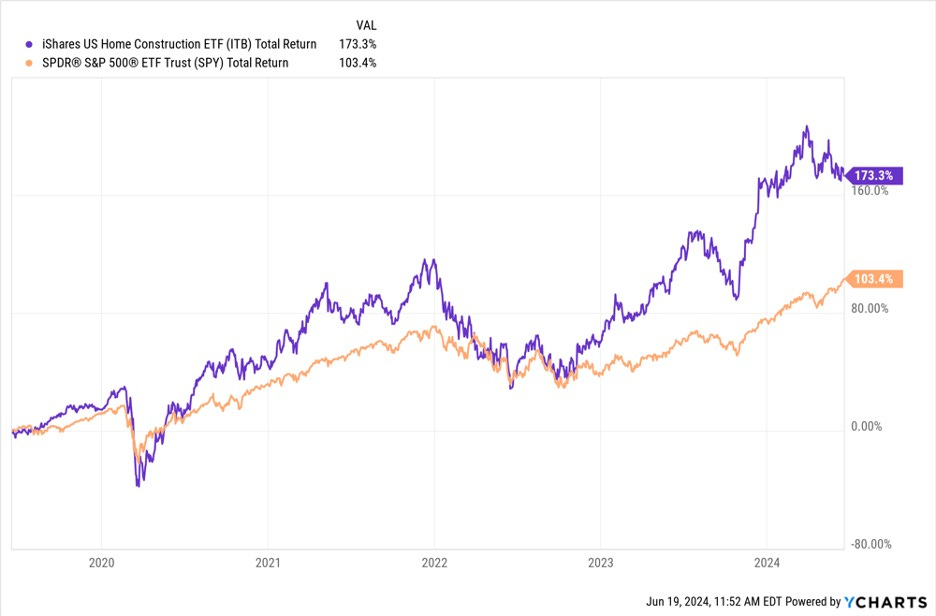
As you can see, as the housing market has heated up in the United States ITB has started crushing the S&P 500.
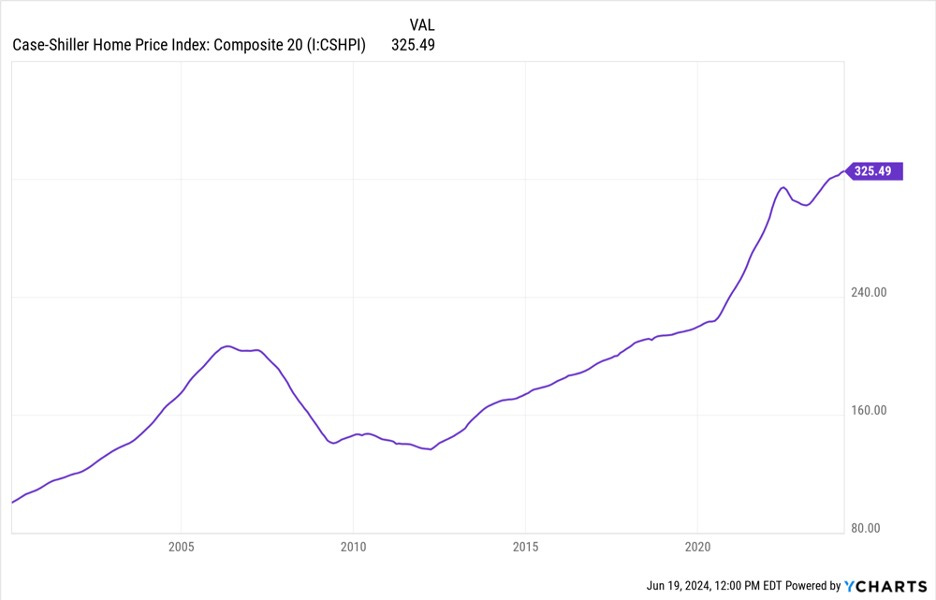
This is the Case-Shiller Price Index from January 1st, 2000, until today. The average price of a home in the United States has increased 223.6% since the year 2000. That’s an annualized increase of 9.3%, likely slightly more than that since 2024 isn’t over yet. The Case-Shiller Price Index Composite 20 tracks the values of homes across 20 metropolitan areas in the United States. Specifically, it looks at the variance in price between the same homes. If House A sold for $200,000 in 2010 and then House A sold for $300,000 in 2020, Case-Shiller would use these data points as part of the calculation for home price increase. This approach controls for the varying quality and unique attributes of different homes. Since homes, even on the same street, can be quite different. Making a direct apples-to-apples comparison is difficult. This is why the Case-Shiller uses what is called the Repeat Sales Methodology.
For a more thorough explanation of the index methodology, the face sheet can be found here:
With an observation that should surprise no one, home prices have been rising in the United States. Now, we’ve been in a tech bubble for the last decade, at least. It was starting to pop beginning in 2022 but then ChatGPT came out and it started all over again. That makes it all the more impressive that little old homebuilding has been beating the market. I specifically want to avoid a macroeconomic discussion about the housing market as a whole. For example, here is an article about the impact the boomers continue to have:
https://www.wsj.com/economy/housing/baby-boomers-big-homes-real-estate-inventory-3a047cb6
and here is another about housing prices being at an all-time high:
https://www.wsj.com/economy/housing/home-prices-hit-a-record-high-4028acf2
The forces that drive the overall housing market are very complex. The varying behavior of different market participants, population growth, interest rates, and even things like the rise of Airbnb all have an impact. I want to be very clear and hit this point home over and over again in my various writings. I only invest when I believe I have an edge. There’s a reason I don’t make a habit of investing in women’s fashion brands. I don’t understand the demand for the products. Are Coach bags going out of style? I would have no clue. My edge isn’t that I have a greater ability to produce macroeconomic forecasts about the housing market than Wall Street hedge funds.
However, the housing market is a place where I think Main Street has an edge over Wall Street. My family is full of tradesmen, and I have many relatives who own rental properties. As a therapist, I frequently hear clients talk about how they can’t afford to buy a home. Whenever I read a book written by an Ivy League educated author it always strikes me how siloed off into their own world they are. They don’t have exposure to the same word-of-mouth information as the typical person. They miss out on the market signals from everyday life. When I bought my house, we looked at four other homes for sale in our neighborhood. Today, when a house where I live hits the market it is sold within the month, interest rates have yet to slow down this effect. When I go for a jog I count for sale signs, I keep getting about the same number everytime.
The flood of requests my family members get from renters when they list a house. The demand my tradesman family members experience for their skills. Therapy clients talking about how hard it is to afford a home since they are all so expensive. These are Main Street market signals which indicate that homebuilding is still very profitable. The price of a home, has for a long time, gone up faster than the price of the materials and labor used to build them. But should we completely trust Main Street market signals and use nothing else? No.
That’s where the Case-Shiller Price Index comes in. I frankly don’t need a fancy macroeconomic forecast about the future of the housing market. All I need to know is what is happening right now. The Case-Shiller Price Index tells you exactly that. As long as the index is rising, even if its rising more gradually, it’s a strong signal the homebuilding companies will remain profitable. Mix in with the Case-Shiller all the ways that the average person is in touch with the housing market and knowing when to sell is easy. If the Case-Shiller is high and everyone is complaining about how much housing costs, the ITB will perform well. If the Case-Shiller is stagnant or dropping and people are happy about all the options they have when looking for a home to buy then the ITB won’t perform well. The ITB is not an buy and hold forever ETF.
So I’ve shown the ITB beats the market. I’ve provided an explanation for how an everyday person can have an edge against professional investors. As well as when how to spot when it is time to exit the investment. All of that is very important, ITB is industry-specific, it is meant to capture the overall performance of businesses related to homebuilding. But what is ITB? What stocks are in the ETF and what index does it track? Well lets look at how the index is constructed and the stocks in the ETF. First i’ll provide you with direct links.
More information on the iShares US Home Construction ETF:
https://www.ishares.com/us/products/239512/ishares-us-home-construction-etf
More information on the index that it tracks:
Dow Jones US Select Home Construction Index
The top 10 stocks in the ETF account for 66.78% of its total value:
D.R. Horton Inc. – DHI – 13.97%
Lennar Corp. – LEN – 12.33%
NVR Inc – NVR – 8.08%
PulteGroup Inc. – PHM – 7.91%
Lowe’s Companies Inc. - LOW – 4.58%
The Home Depot Inc. - HD – 4.54%
TopBuild Corp. – BLD – 4.36%
Sherwin-Williams Co. – SHW – 4.32%
Toll Brothers Inc. – TOL – 4.11%
Builders FirstSource Inc. – BLDR – 2.58%
The index is market cap weighted, which determines the percentage each stock holds in terms of the overall value of the index. The larger the market cap of the stock the larger percentage of the portfolio it holds. A further restriction is put on how much of the portfolio each type of business can occupy. This allows the index to capture the performance of other businesses that are related to homebuilding without having a retailer like Home Depot consume the entire index. For more specific information about index construction methodology review the documentation provided by Dow Jones.
Lets look at some charts that can show us some basic information about the stocks in this portfolio. Are they undervalued? Are they debt heavy? Is this basket of homebuilding stocks something anybody want would to own even if they are outperforming fight now.
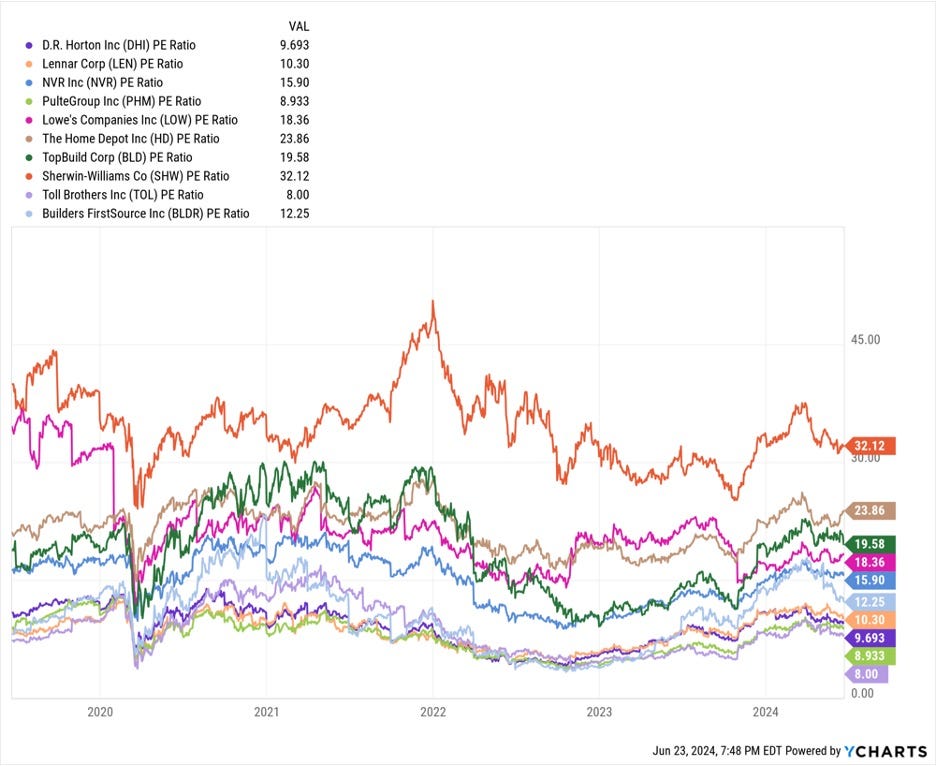
There is an outlier with Sherwin-Williams PE in excess of 30. But by and large the industry is fairly valued. The average PE of the entire portfolio is 13 as of this writing. That includes all the stocks not just the ten shown here. It’s clear that homebuilding and related stocks are not overvalued. The valuations are not inflated with the hopes and dreams of investors which what leads to high PE’s and creates large downside risk. Something that is frequently characteristic of the tech sector.
Now let's look at the basics of each of the top 10 stocks in the portfolio.
D.R. Horton Inc. – DHI – 13.97%
https://investor.drhorton.com/
Market Cap: $49.8 Billion
Shareholder Equity: $23.8 Billion
Debt To Equity Ratio: 0.25
Current Ratio: 12.77
EV to EBIT: 8
ROIC: 17.4
Lennar Corp. – LEN – 12.33%
Market Cap $42.1 Billion
Shareholder Equity: $26.88 Billion
Debt to Equity: 0.08
Current Ratio: 15.73
EV to EBIT: 7.3
ROIC: 13.58%
NVR Inc – NVR – 8.08%
Market Cap: $23.9
Shareholder Equity: $4.3 Billion
Debt to Equity: 0.21
Current Ratio: 5
EV to EBIT: 11
ROIC: 32.25%
PulteGroup Inc. – PHM – 7.91%
https://www.pultegroupinc.com/investor-relations/investor-overview
Market Cap: $23.5 Billion
Shareholder Equity: $10.77 Billion
Debt to Equity: 0.23
Current Ratio: 4.98
EV to EBIT: 6.5
ROIC: 21.97%
Lowe’s Companies Inc. - LOW – 4.58%
https://corporate.lowes.com/investors
Market Cap: $130.26
Shareholder Equity: $-14.6 Billion
Debt to Equity: -2.46
Current Ratio: 1.166
EV to EBIT: 14.77
ROIC: 33.91%
The Home Depot Inc. - HD – 4.54%
Market Cap: $352.82 Billion
Shareholder Equity: $1.82 Billion
Debt to Equity: 23.53
Current Ratio: 1.34
EV to EBIT: 18.27
ROIC: 33.92%
TopBuild Corp. – BLD – 4.36%
Market Cap: $12.36
Shareholder Equity: $2.7 Billion
Debt to Equity: 0.52
Current Ratio: 2.8
EV to EBIT: 13.84
ROIC: 16.48%
Sherwin-Williams Co. – SHW – 4.32%
https://investors.sherwin-williams.com/
Market Cap: $76.38
Shareholder Equity: $3.5 Billion
Debt to Equity: 3.0
Current Ratio: 0.7897
EV to EBIT: 24.52
ROIC: 17.31%
Toll Brothers Inc. – TOL – 4.11%
https://investors.tollbrothers.com/
Market Cap: $12 Billion
Shareholder Equity: $7.3 Billion
Debt to Equity: 0.39
Current Ratio: 4.11
EV to EBIT: 6.9
ROIC: 16.34%
Builders FirstSource Inc. – BLDR – 2.58%
Market Cap: $17.48 Billion
Shareholder Equity: $4.96 Billion
Debt to Equity: 0.75
Current Ratio: 2.21
EV to EBIT: 9.83
ROIC: 18.13%
Now let's think about the common themes here. The only two debt heavy companies with razor thin equity were Lowes and Home Depot which are national retail chains. It makes logical sense why they are included in the index but the high amount of debt they carry isn’t typical of the other stocks in the index. Current Ratio was frequently higher than one, for the top 10 companies, which is a good indication of liquidity. EV to EBIT another method of valuation that is more complete than PE further showed that the industry isn’t overpriced. ROIC also shows a healthy amount of profit being made.
There just isn’t a whole lot to dislike. Everyone has been focusing on tech stocks, yet again. Meanwhile, homebuilders have been stacking up money, profiting from the high price of real estate in the United States right now. The main problem with investing in a homebuilding company is that it is a no moat industry. I don’t think one homebuilding company has any kind of sustainable advantage over another. The same goes for just about any closely related business. This is why I like the iShares U.S. Home Construction ETF, ticker symbol ITB, approach to investing in this industry. Any concern about competitive arbitrage between various the homebuilding companies is diversified away. The Case Schiller Home Price Index provides a valid sell signal on top a more classic momentum-based sell signal such as the share price dropping below the 200-day simple moving average.
Main Points:
Diversified across the homebuilding industry. No risk of competitive arbitrage.
Currently outperforming the S&P 500.
The average person has important insights into the housing market through their daily life.
The Case-Schiller Composite 20 Index provides a clear sell signal.
Companies within the ETF are of sound financial strength and are not overvalued.
This a relatively easy path to outperforming the S&P 500 for as long as housing remains expensive in the United States.
Disclaimer:
As always, don’t go around blindly trusting what you read on the internet. I can and will be wrong. There is nothing safe about investing in the stock market. You can lose all of your money.