


Advanced Micro Devices - AMD
So expensive your eyes will bleed.

Sometimes, for fun, I like to dive into a stock I don’t like. It’s a nice reminder of how foolish the concept of 100% efficient markets is. So, here’s a stock that I think is a flaming pile of dog crap. AMD’s share price is truly a testament to cognitive bias in human decision-making. This time I’ll start with the price charts so that as I continue on in the analysis, you can keep in mind just how much of this company’s share price is all hopes and dreams.
AMD vs. S&P 500 as far back as I have data:

AMD vs. S&P 500 over the last ten years:

AMD vs. S&P 500 over the last five years:

AMD vs. S&P 500 over the last three years:

AMD vs. S&P 500 over the last year:

As you can see, the point in time at which you buy stock in AMD has historically been very important. It also, once again, highlights my negative view of a blind, long-term buy-and-hold approach. If someone bought AMD back during the '90s tech bubble, their investment underperformed the S&P 500. Truthfully, the beginning of the FAANG stock bubble was the best time to buy AMD, and the return has gotten worse as more time has passed. Ten years ago, it was a killer investment. Five years ago, it was still a good-performing investment but not insane, and AMD has been a losing investment for the last three years. However, AMD’s share price has only performed well because of investor expectations, never because of the underlying business improving.
Now let's look at revenue and valuation. I also want to pair these charts with share price. The gap between the percentage of revenue growth and the percentage of increase in the share price is a strong indicator of how much of the share price is based on investors' expectations as opposed to a factual increase in the value of the company.
Share price and revenue growth over the last ten years:

Share price and revenue growth over the last five years:
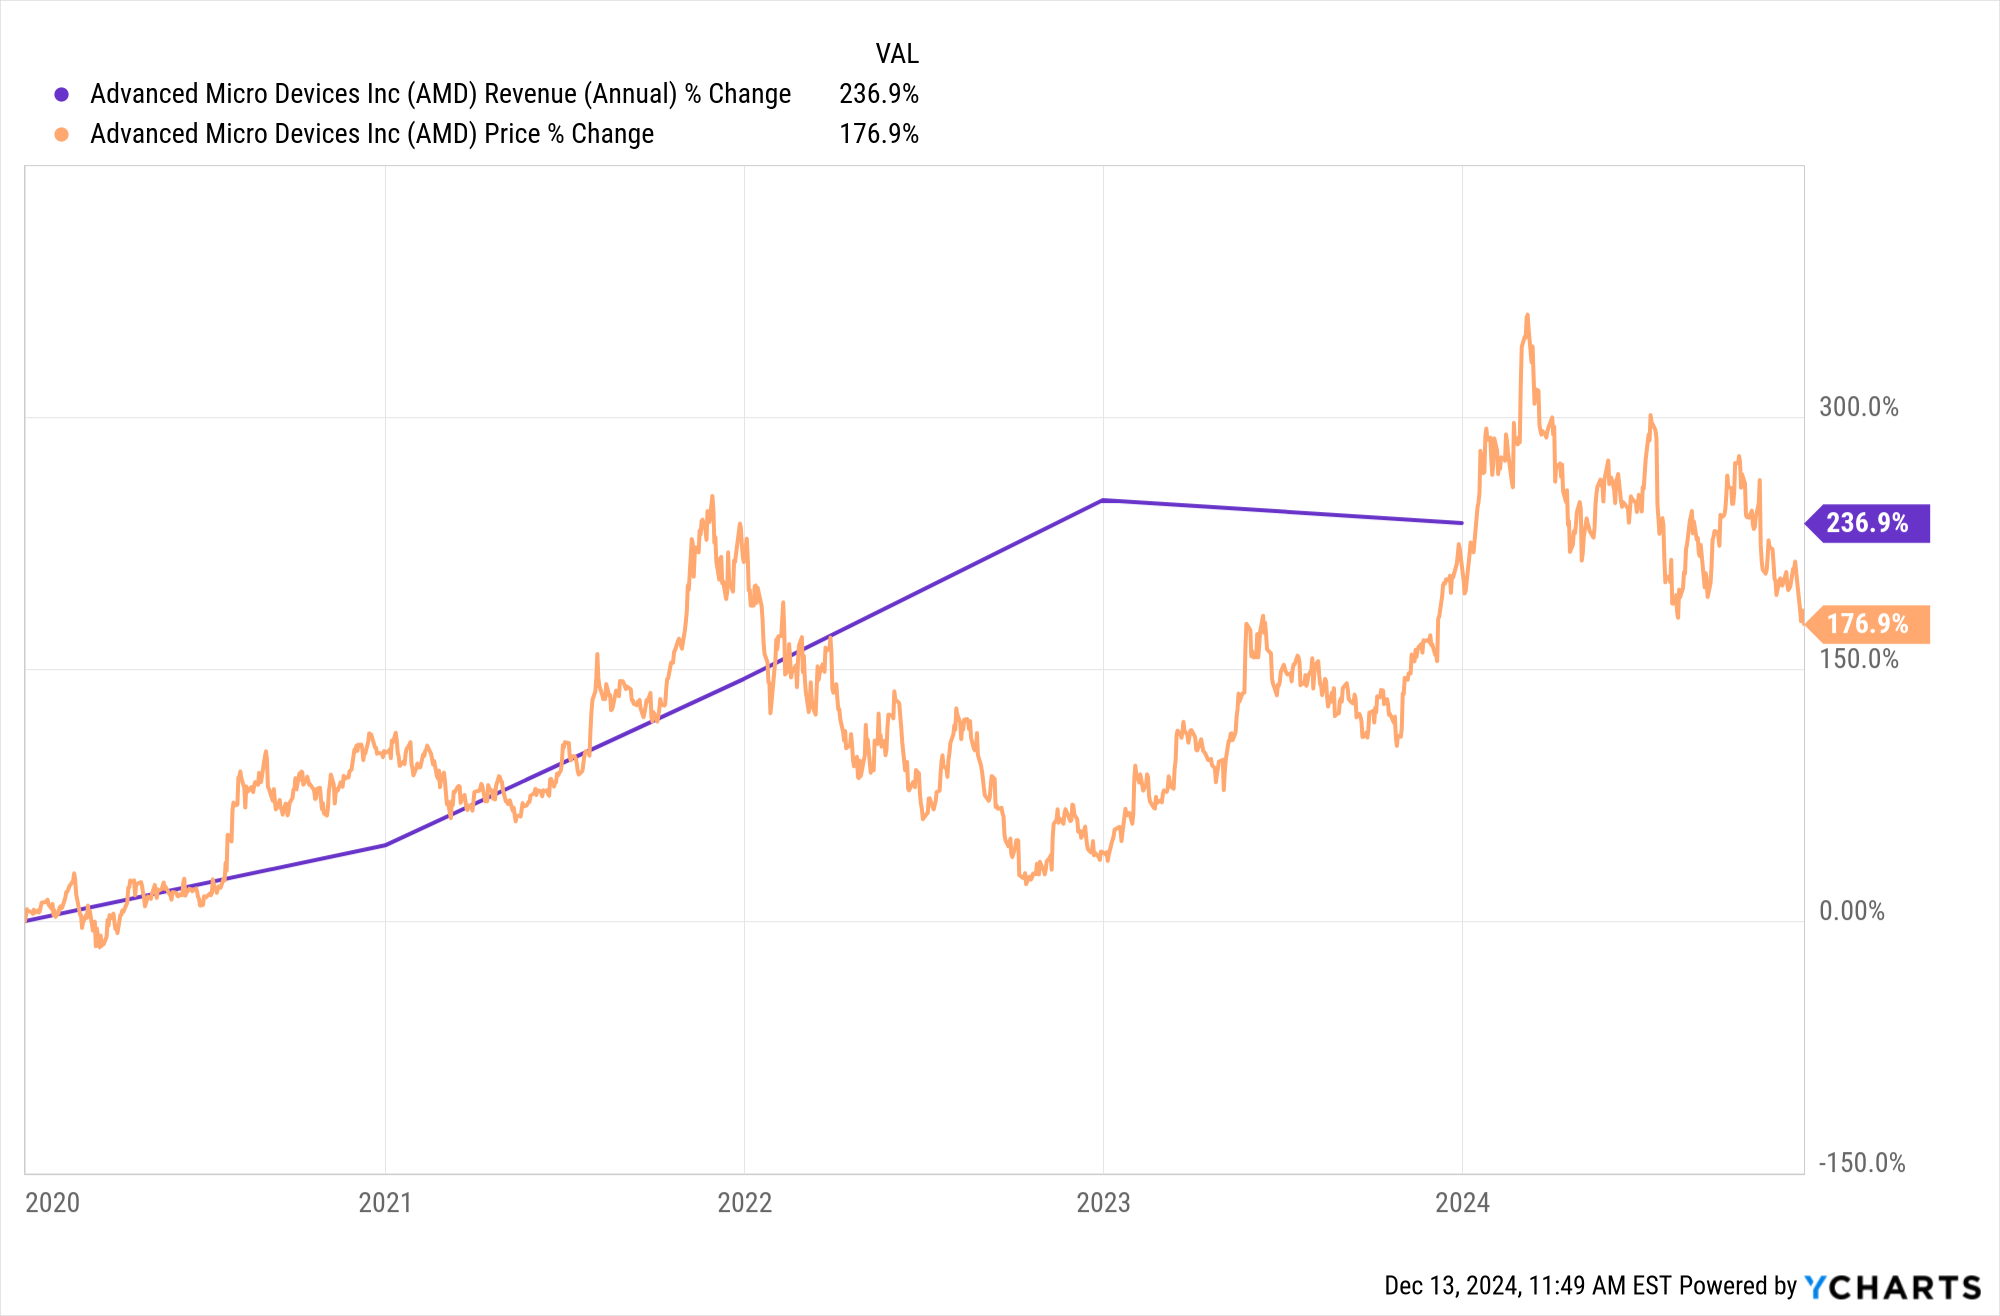
We can see how, over the last decade, the share price has increased at a rate that vastly exceeds revenue growth. However, over the last five years, the two figures have been moving closer together. The revenue line stops at the beginning of 2024 since AMD doesn’t file their 2024 10-K until the end of the fiscal year. These two charts support my prior statement that investor hopes and dreams are the basis of the share price rising. Over a ten-year period, there is little relation between AMD’s share price growth and revenue at all. Over a five-year period, the two are more closely aligned. However, this doesn’t completely reflect rational investor behavior, given AMD’s already insanely high valuation. It does show that investor belief in the narrative around the stock is cracking, and the share price isn’t skyrocketing anymore. Rational behavior would suggest an inverse correlation on the five-year graph, given the PE.
10 Year PE chart:

A PE ratio of 114 equals an earnings yield of 0.8%, which is 750% lower than the 6% yield on the bonds I just purchased. In order for an investment in AMD’s stock to match the yield on the bonds I just purchased, there would need to be about a 600% increase in net income. Mind you, the share price of the stock would have to hold still while the net income rose for this to be accurate. If investors are still high on crystal meth and just keep bidding up the share price in tandem with a net income increase, then the insane PE ratio would persist. This can’t even be laid at the feet of retail investors as a meme stock craze. The institutional investor ownership percentage of the stock is very much in keeping with the average. Dumb money can also be found on Wall Street.
To summarize so far… AMD frequently underperforms the S&P 500. The times AMD has outperformed the S&P 500 are also the times when its share price has deviated sharply from its underlying revenue growth and fundamentals. The next chart helps explain why AMD has underperformed the S&P 500 for the last three years and why its share price movements are closer to its revenue movements over the last five years.
AMD’s revenue growth vs. Nvidia‘s:

ChatGPT is what sent AMD’s share price soaring again at the end of 2022 and in early 2023. However, the AI revenue growth story isn’t panning out for AMD. While Nvidia’s revenue has exploded, AMD’s has remained flat. What did AMD’s share price do in 2022 when the FAANG bubble burst, before ChatGPT initiated a new tech bubble all over again?

Oh look there was a 58% decrease in its share price….
That is quite a lot of hot air coming out of the share price, and AMD still had a PE over 30 for nearly all of 2022. It could have fallen another 50% from this bottom. Intel is living proof that these semiconductor companies are far from invincible; they can crash to earth very hard. This is very likely to happen to AMD again sometime in the near future as the narrative driving investors' expectations begins to fall apart
10 year historical net income:

Notice that prior to 2018, the chart dips below the zero line, meaning that AMD was losing money. AMD’s line of Ryzen CPUs is what initially led to the share price taking off. The sentiment was that Intel’s days as the number one CPU manufacturer were numbered, which didn’t happen. Intel still has much more market share in CPUs than AMD does. Interestingly, AMD’s earnings have only gone down since the AI craze began. Pandemic purchasing of PCs began to fade, and AMD hasn’t capitalized on AI in any meaningful way. Thus, we see net income contract.
This is what makes investing such a challenge. You can be correct while still ending up wrong. Yes, AMD’s line of Ryzen CPUs was a huge boon to its net income. Yes, AI has been a huge source of revenue for the semiconductor industry writ large. However, all of AMD’s future earnings from its Ryzen CPU line were priced in by late 2019. Anyone who bought stock since then has overpaid. So, yes, some of the things that people were expecting did happen, making them correct. But they were also incorrect about the magnitude of the change and thus ended up making a bad investment. If someone bought into the AMD narrative and cashed out at a high, making money, that would be a function of luck and not a strategy that will be repeatable in the future. This is why process matters more than one individual outcome.
Allow me to explain… AMD’s peak annual EPS was 2.6 in 2021, dropping to 0.5 by the end of fiscal year 2023. A fair valuation is about a PE of 15, and 15 × 2.6 = 39. At AMD’s highest EPS, a proper valuation would have been a share price of $39. Well, AMD’s share price crossed the $39 mark in late 2019 and has never been anywhere close since. At its low, when the share price tanked in 2022, the share price only dropped to $57. The share price currently sits at $126.91 and has risen despite a decrease in earnings and a plateau in revenue. AMD has a total EPS of 0.76 through the first three quarters of 2024. In order to justify its current share price, AMD would need an annual EPS of 8.46, something it has never been close to. And yet, nearly all analysts list the stock as a buy. Morningstar, who I usually respect, lists a target share price of $160 and claims AMD is undervalued, purely on expectations of AI-based revenue growth.
To provide context, let’s compare what we have seen in AMD’s charts to Fiserv.
Fiserv share price and revenue growth over the last ten years:
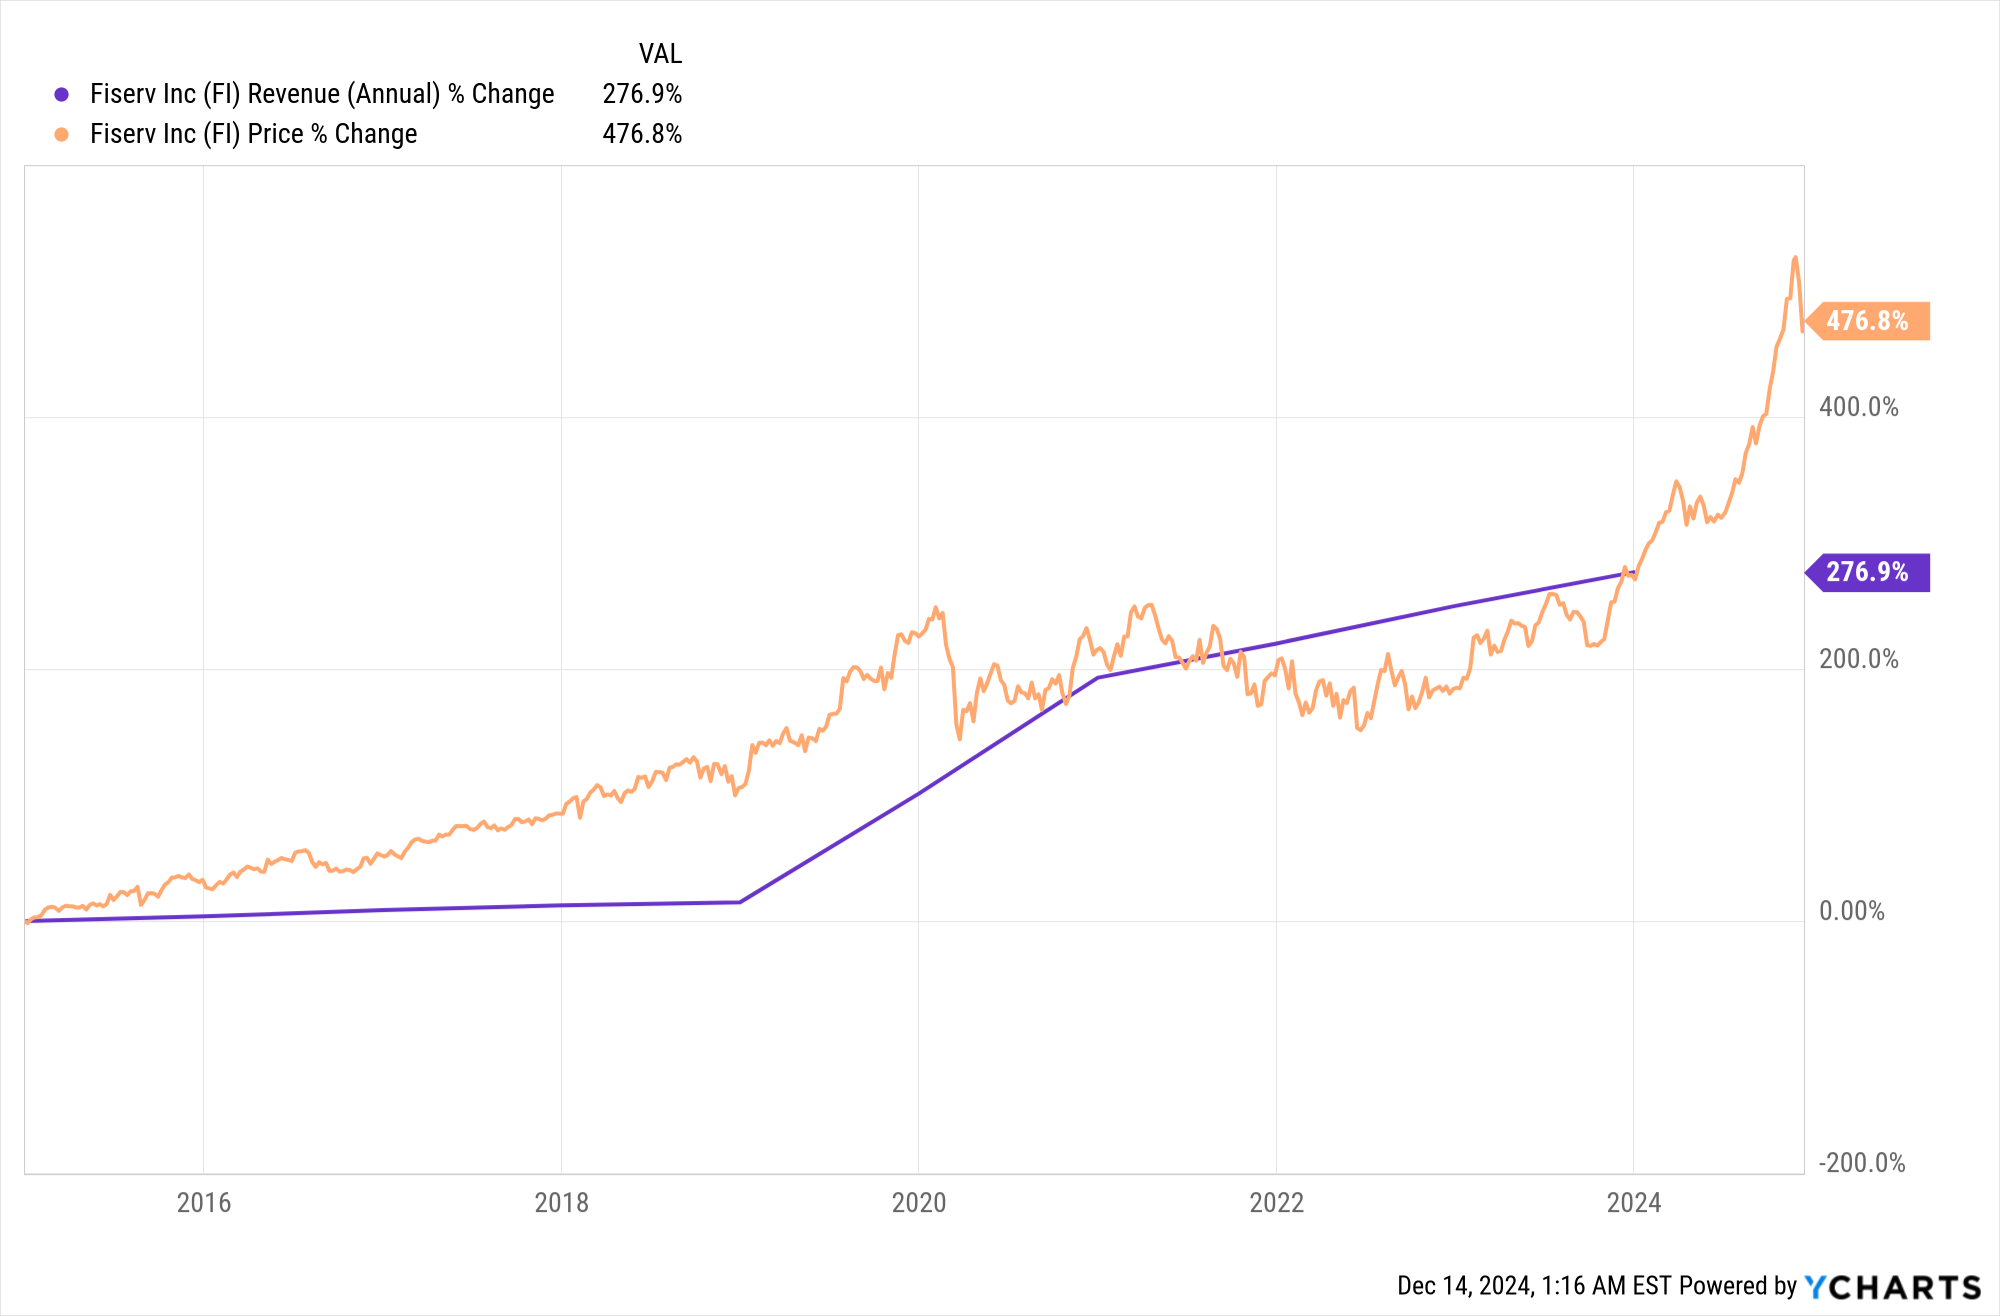
Up above, there was a massive gap between AMD’s share price and revenue growth over the last ten years. Need I repeat myself again about how that gap indicates hopes and dreams versus cold hard facts? Well, with Fiserv, sure, the stock trades at a high PE, but it has been backed up by results—aka revenue growth. Mind you, Fiserv’s current PE of 40 is downright tame compared to AMD’s PE of 114. But the above charts explain in a pretty clear manner why I view Fiserv sitting at a PE of 40 as a value buy and AMD as an extremely risky purchase. I did a write-up on Fiserv previously; my full thesis on the stock is there. I mainly wanted to highlight what a rational chart looks like versus an irrational one.
Could AMD pan out in the future? Maybe. It hasn’t happened yet, and investor expectations have repeatedly been shown to be overblown on this stock for the last decade. But if an investor is convinced that this time victory is on the horizon, they need to realize that the high premium they are paying is all risk. A decade into AMD’s crazy overvaluation, it has never lived up to the hype.
Okay, I’m going to go play chess. Bye-bye now.
My Portfolio:
FI, ADP, MCD, AFL, AXR, VLO, SHV
METC $17 Call 6/20/2025
FedEx Bond CUSIP: 313309AP1
JP Morgan Chase Bond CUSIP: 48130CVM4
*Disclaimer*
You can and will lose money in the stock market. You can lose all of your money. I can and will be wrong. I have been wrong in the past. I have lost money in the past. Investing in stocks is risky and should never be considered safe. Invest at your own risk.